What are Dashboards?
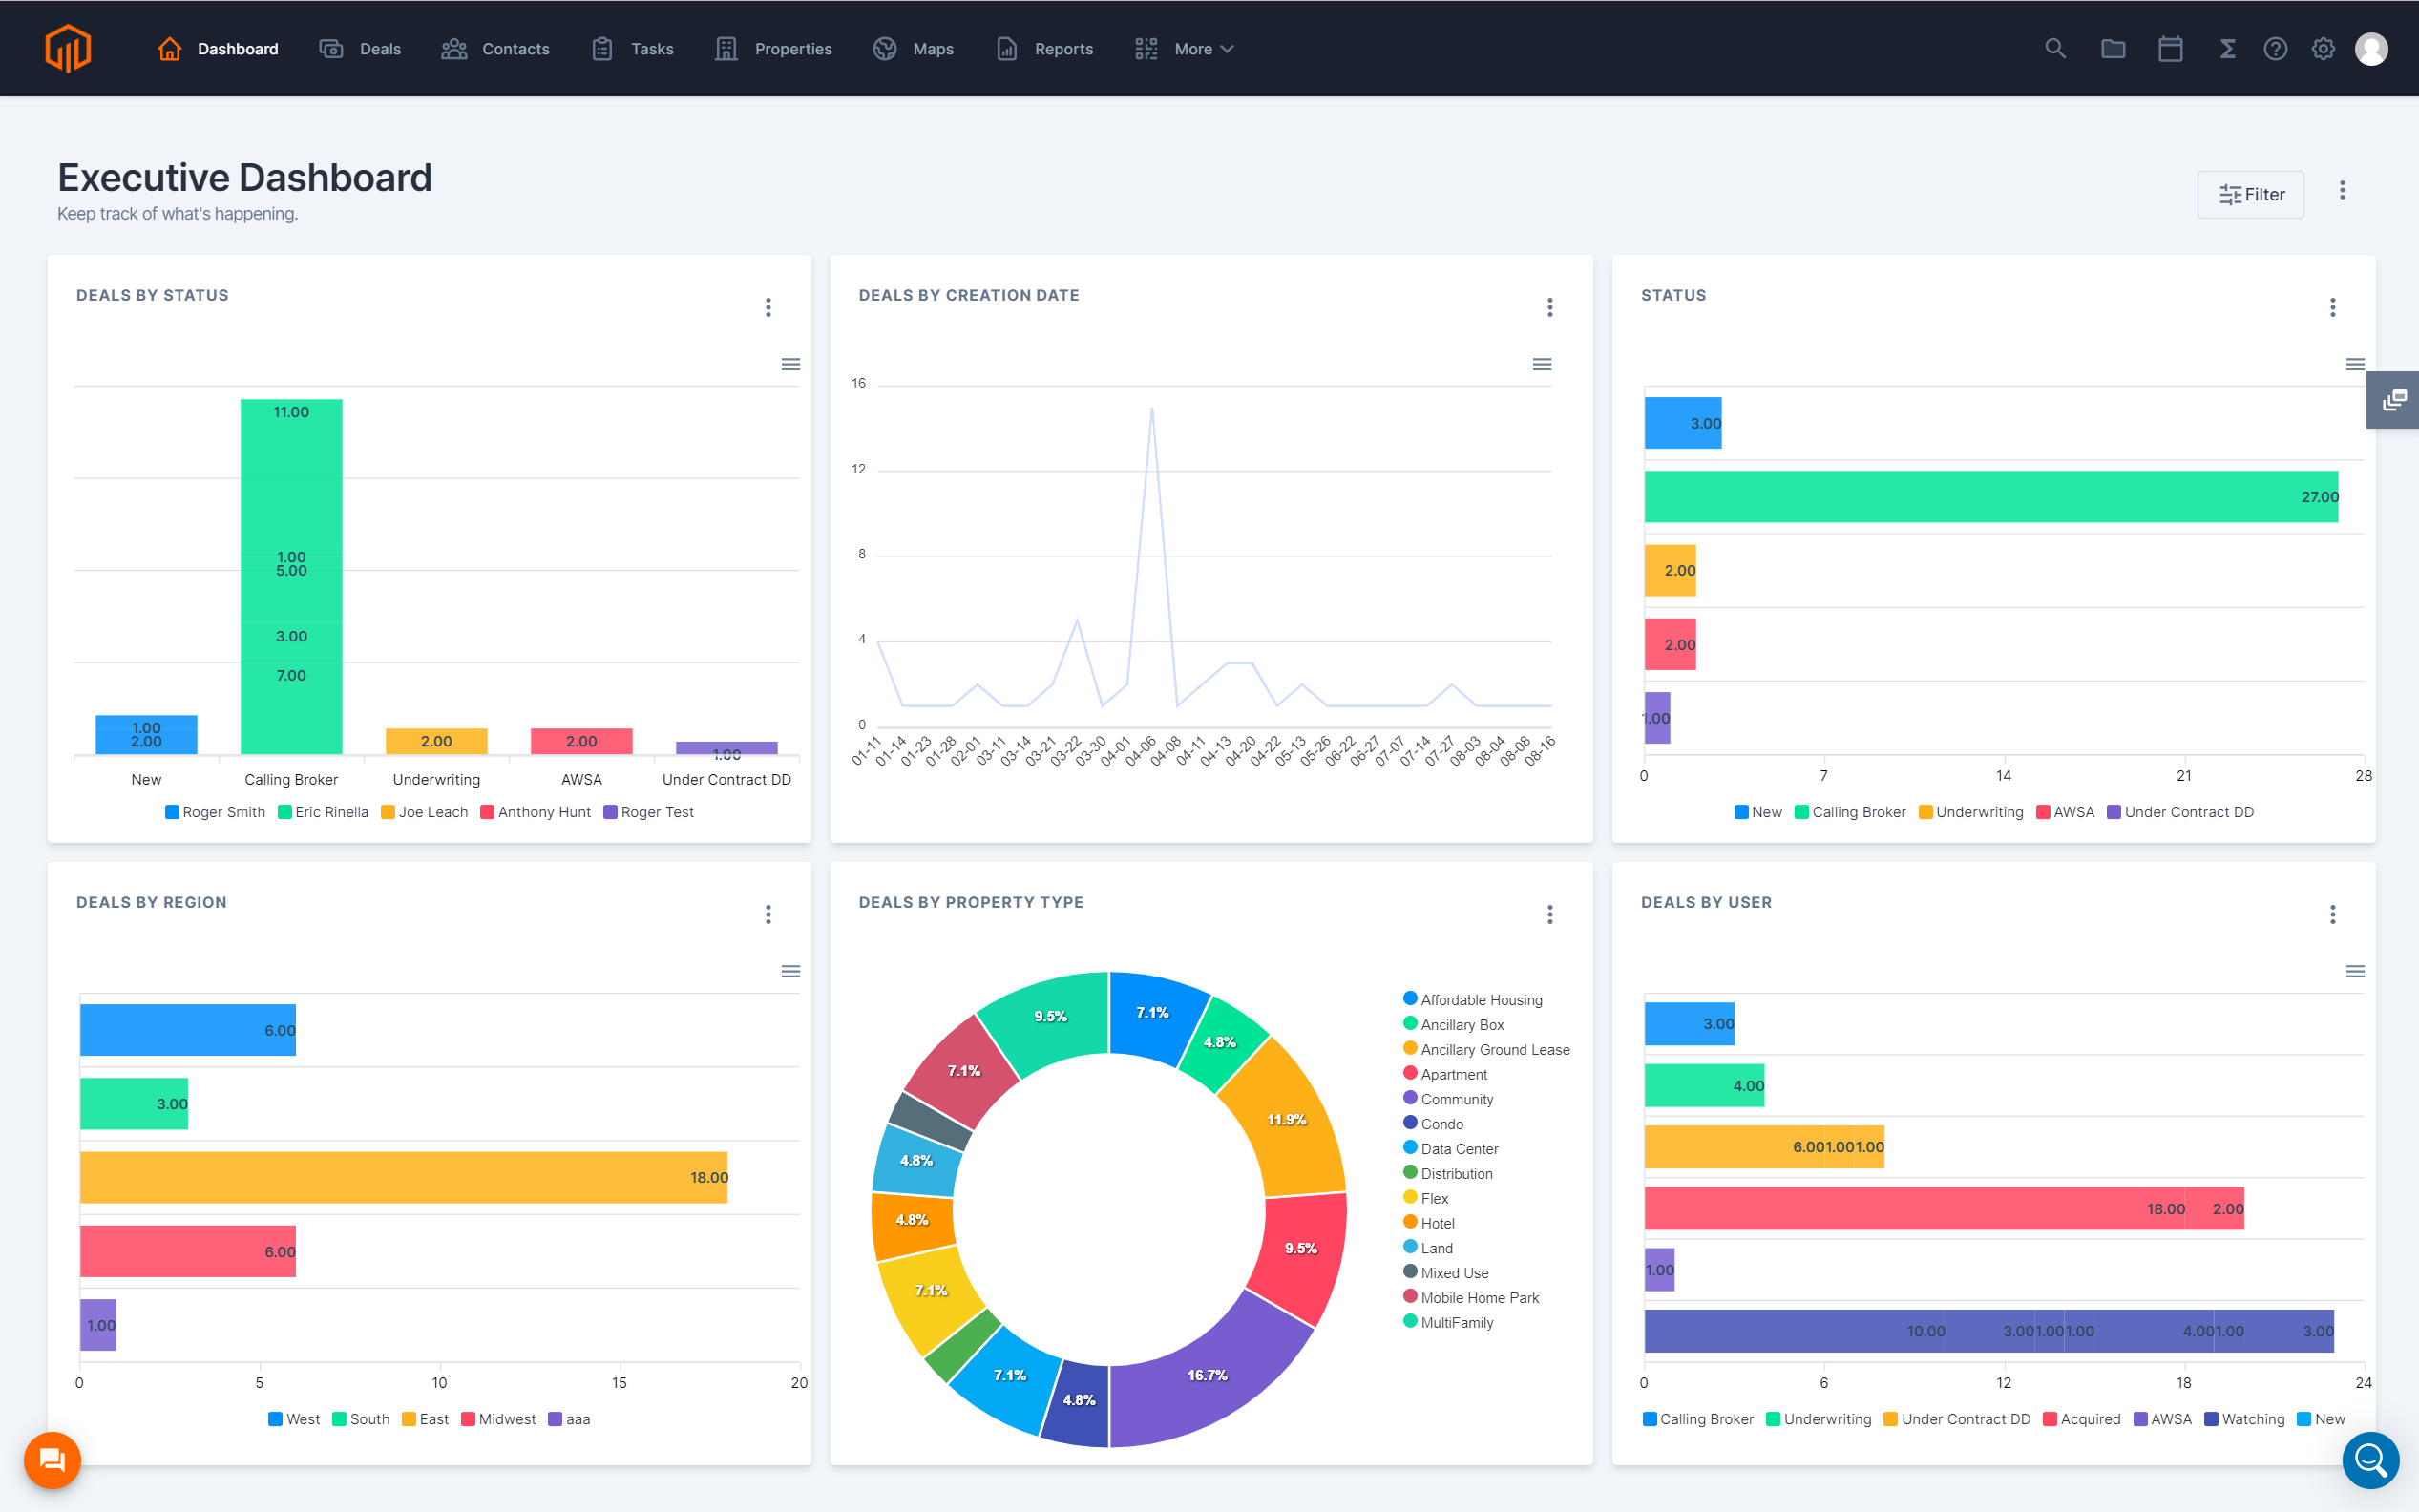
Turn key data points into visual dashboards to help identify trends and drive strategic decision making.
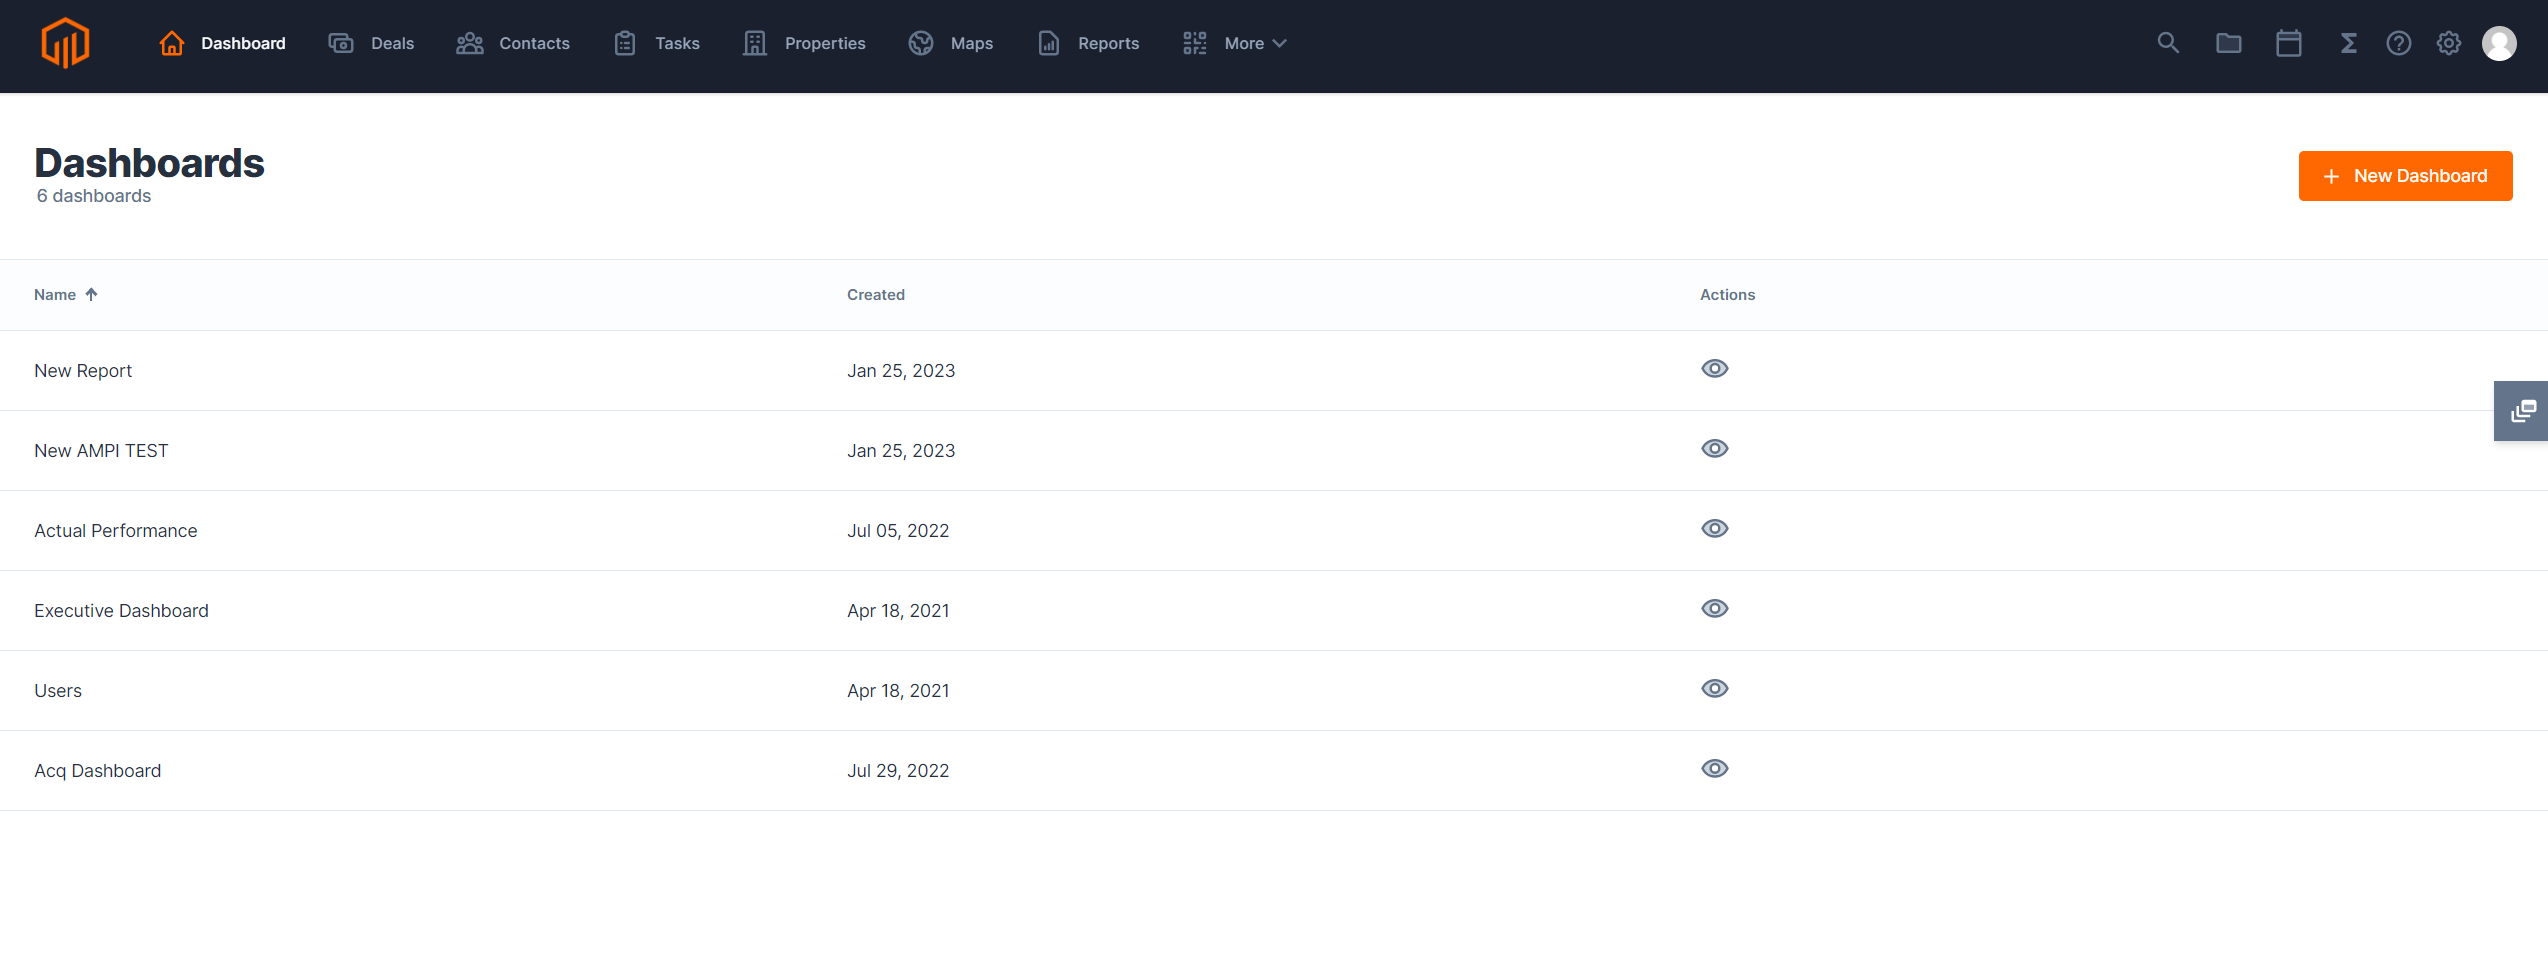
When Report Visualizations are brought together in one at-a-glance view, they're referred to as Dashboards in TermSheet.

💡Things to Consider:
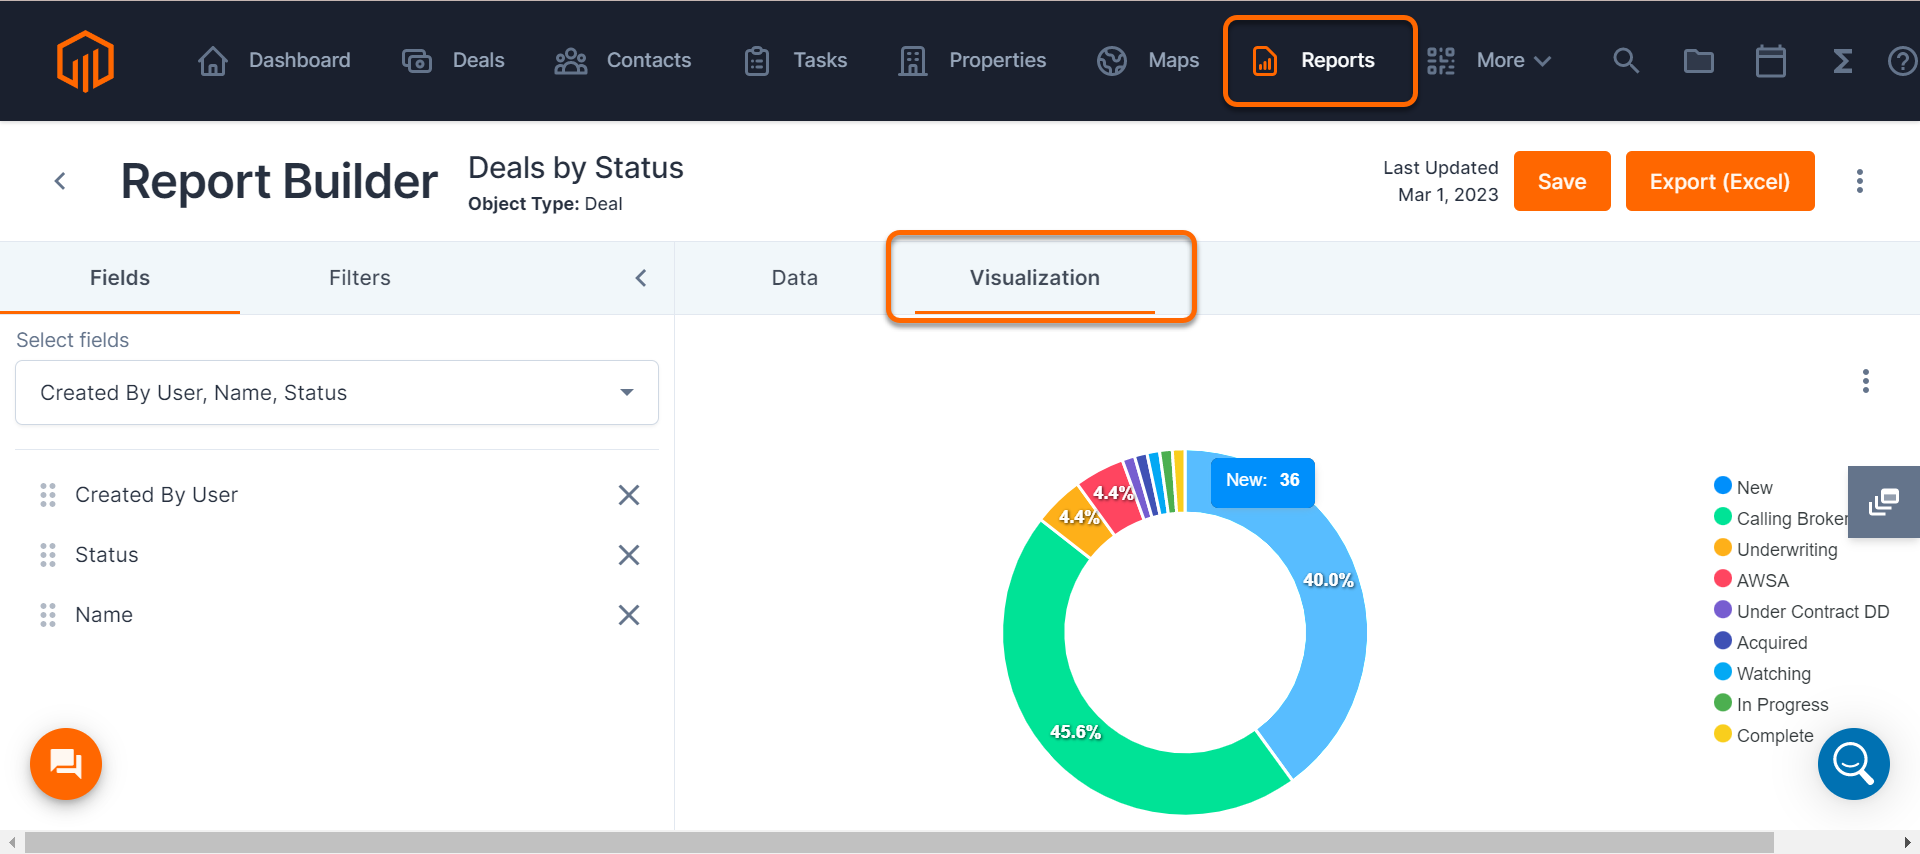
The type of chart that appears in the dashboard is determined by the visualization created in the Reports tab.
Changes to the Report Visualization are dynamic and will update the charts within existing Dashboard views.
Dashboards Overview
Construct dashboards by pulling in report visualizations to ramp up the power to identify trends and drive strategic decision making through charts and graphs.

View high-level metrics across multiple reports from the dashboard, then navigate to Reports to drill down to deal specifics.

🚀Getting Started with Dashboards
✅What are the key metrics you monitor frequently?
✅Group like metrics together in Dashboards
