Add or Edit a Dashboard
Dashboards display multiple charts and visualizations in a single view.
Dashboards are intended to give users an at-a-glance view of critical data. There is no limit to the number of dashboards that can be added to an account or the number of charts that can be added to a dashboard.
📑 Learn to:
💡Things to Consider
While there is no limit to how many charts you can add to any one line, we recommend no more than 2-3 to maintain legible chart details.
The type of chart that appears in Dashboards is determined by the visualization created in the Reports tab.
There is no way to reorder or sort charts once they have been added to the dashboard. To edit the layout of a dashboard, delete and re-added charts in the desired order, working left to right in line and top to bottom.
⚙️ Steps
Add a New Dashboard
-
Select Dashboards from the company level tools, then select "All Dashboards" to access the list view.
-
Select "+ New Dashboard"
-
Name the new dashboard. This name will display in the list view so be descriptive so that it is easy to identify what this dashboard contains.
-
Select Save.
-
Follow the prompt to add the first chart to the dashboard.
-
Use the dropdown to select a report. If there are no reports in the dropdown, navigate to Reports in the main menu to create one. (Add a Report)
-
Once "Add" is selected, the report visualization will be added to the dashboard as a chart and the data will begin to populate automatically.
Add Additional Charts or Edit an Existing Dashboard
-
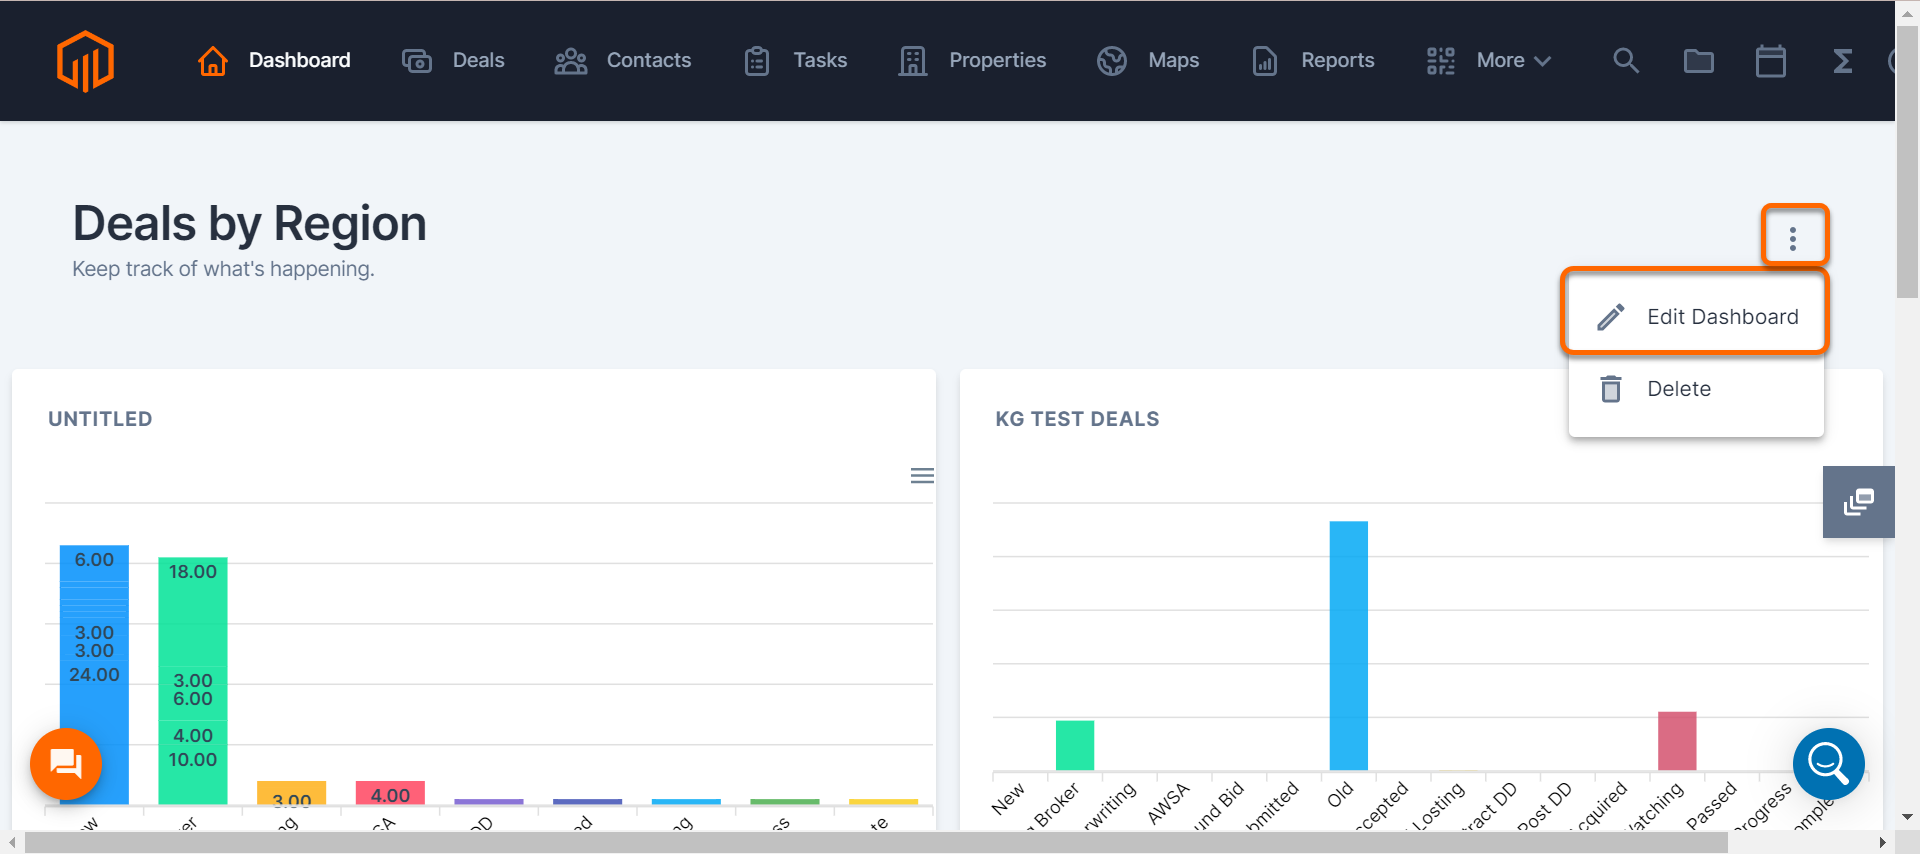
Select the ⁝ icon to view additional options. Then, select "Edit Dashboard".
-
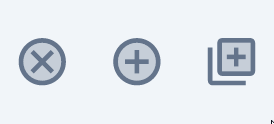
Select an icon to update the dashboard.
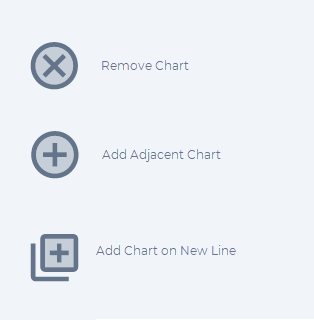
To delete charts from the dashboard: Select the x icon to remove the chart.
To add charts to the dashboard: Select one of the + icons.
Add Adjacent Chart: add a chart to the row, to the right of the existing charts.
Add Chart on New Line: add a chart to the row below.
Select the ⁝ icon to view additional options. Then, select "Edit Dashboard".
Select an icon to update the dashboard.
To delete charts from the dashboard: Select the x icon to remove the chart.
To add charts to the dashboard: Select one of the + icons.
Add Adjacent Chart: add a chart to the row, to the right of the existing charts.
Add Chart on New Line: add a chart to the row below.
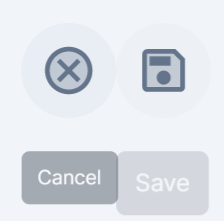
Select the x to cancel changes and revert back to the last saved version of the Dashboard. Select the save icon to apply the changes.
Delete a Dashboard
-
Select a dashboard to view it.
-
Select the ⁝ icon to view additional options. Then, select Delete. This will delete the entire dashboard.
(To delete a chart on the dashboard rather than the entire dashboard, edit the dashboard as outlined above)


